What it holds
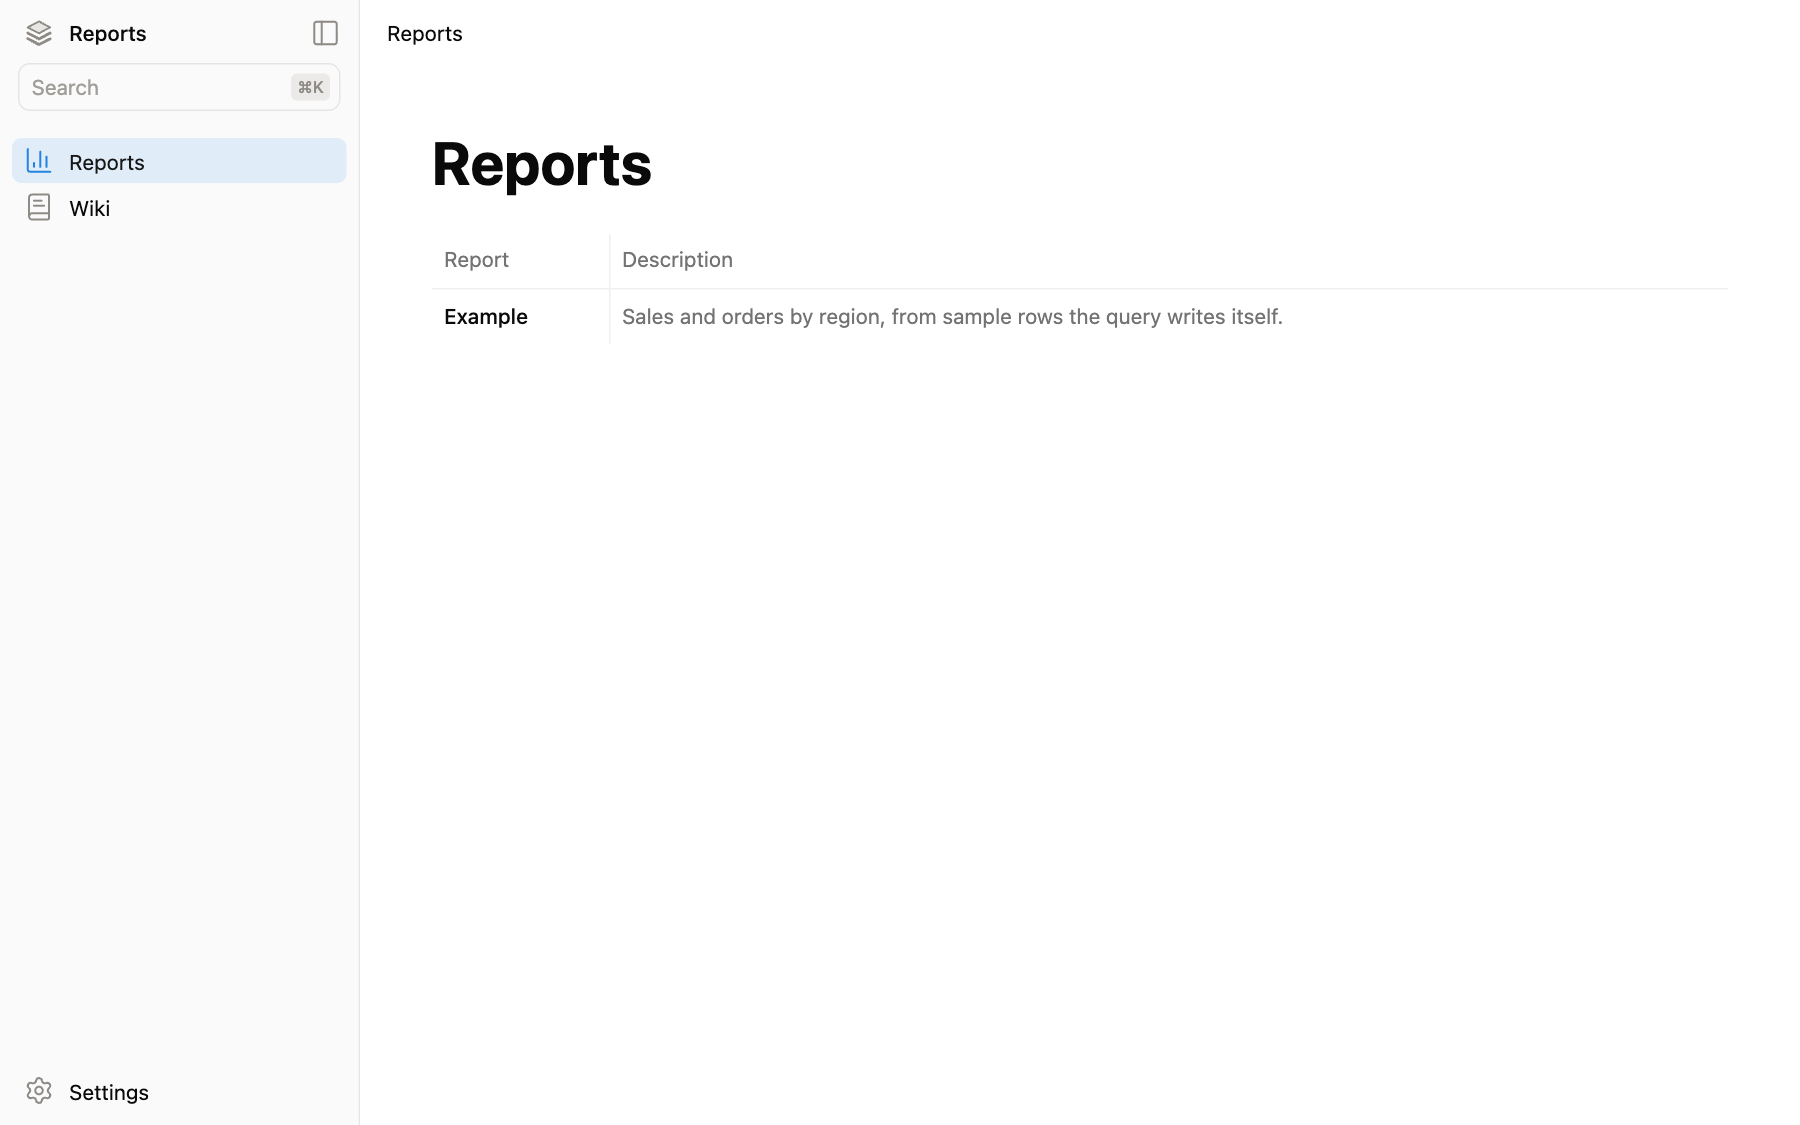
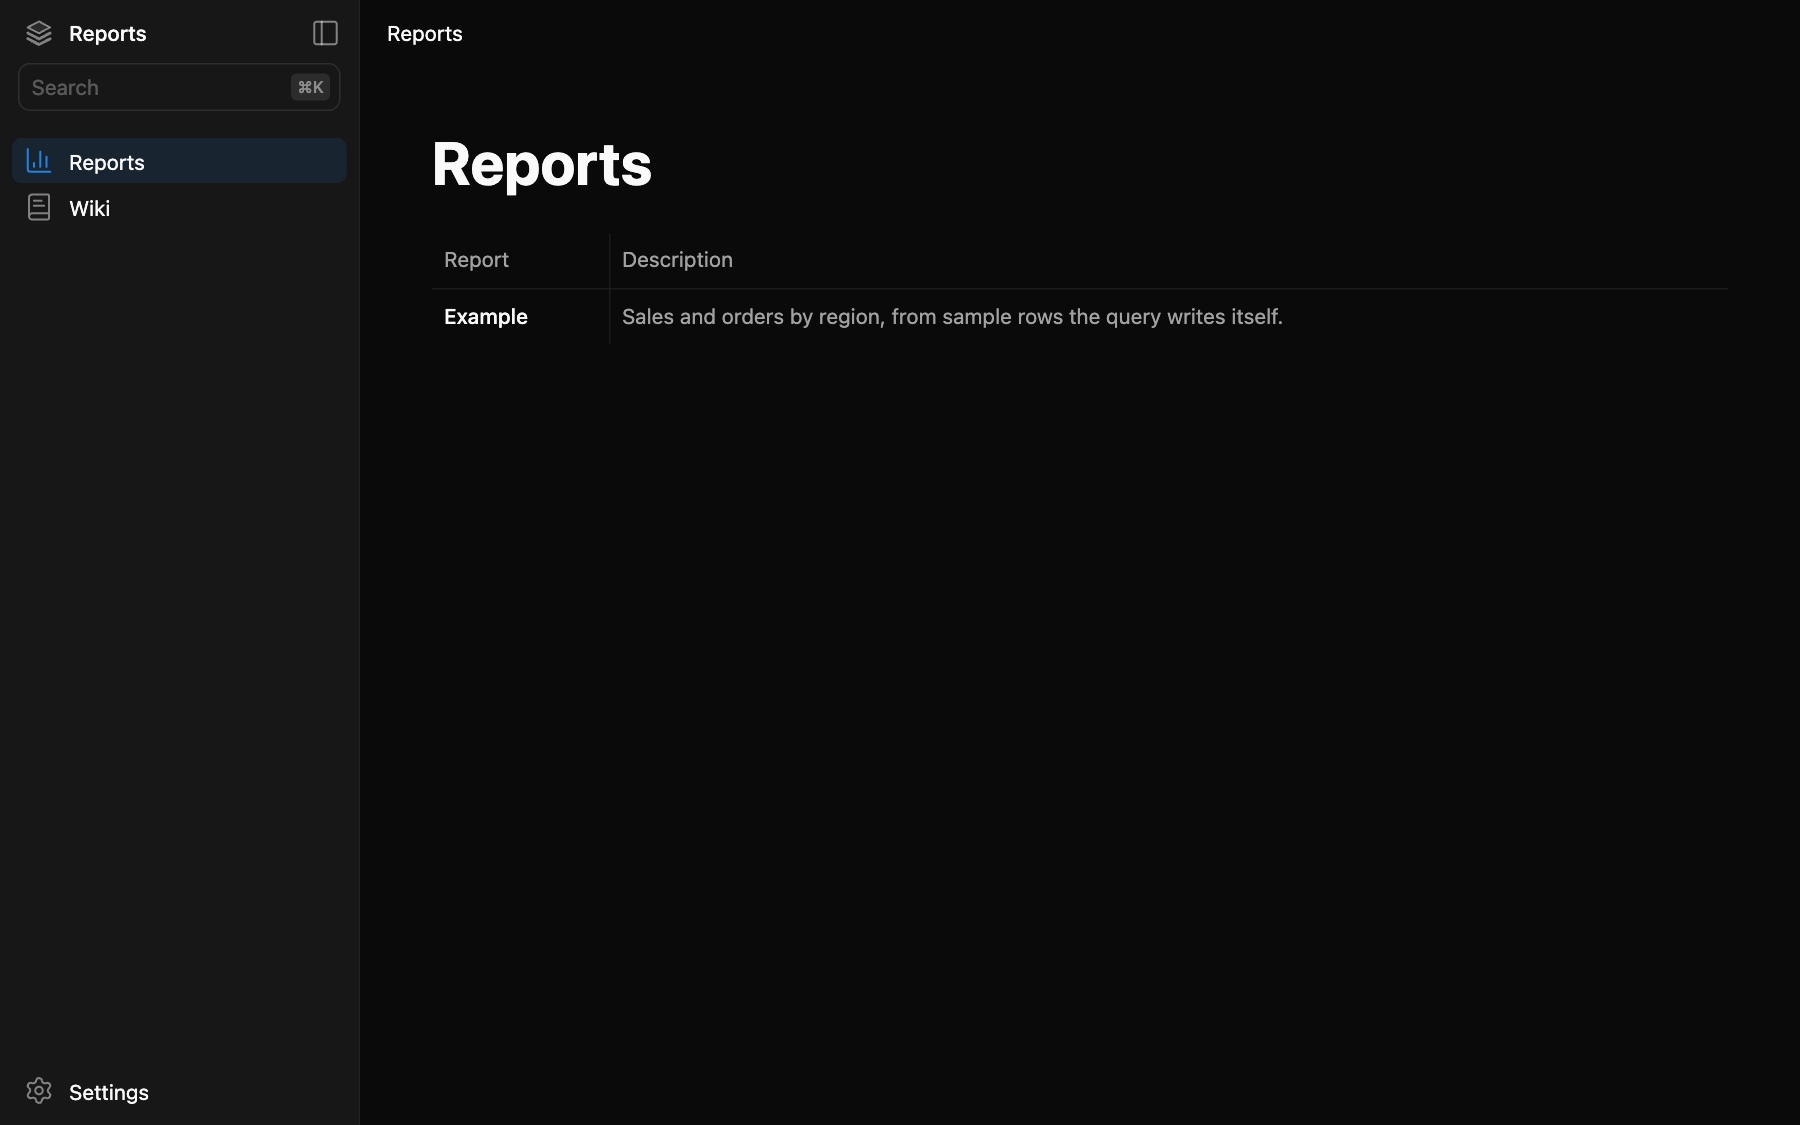
Reports is the first module in the app’s sidebar, at /reports. It lists every report by its title and description, and /reports/<id> opens one. A new app has three example reports for a made-up data society: Events, Members and Website visitors. They read sample CSV files that come with the app, so they work before you connect anything; an app without the csv connector shows them as not connected.
You add a report by asking Claude: “Make a report of sales per month, with a chart and a table.” Claude writes it, checks it and it appears in the list.
Where its files live
A report is its folder: adding the folder adds the report to the list, and the folder name is its URL.
Settings
Settings → Reports shows the module’s name, the code behind its screens and its folder, app/src/reports/.