You do three things yourself: pick a look in Create, copy a prompt, and paste it into Claude. Claude types every command and tells you what it did.
What you need
- Node.js 20.12 or later and git. Two free programs: Node.js runs the app, and git downloads it and later keeps saved versions of your work. Get them from nodejs.org and git-scm.com. Not sure you have them? Once Claude is open, ask it: “Check that Node.js and git are installed on this computer, and tell me their versions.”
- The Claude desktop app, with its Code tab. That is where you talk to Claude about your app. You need a Claude plan that includes Claude Code.
- Your data. A CSV or Excel export of one table is enough to start. You can also start with none: the app comes with example data.
Set up the app
Pick a look and your data in Create
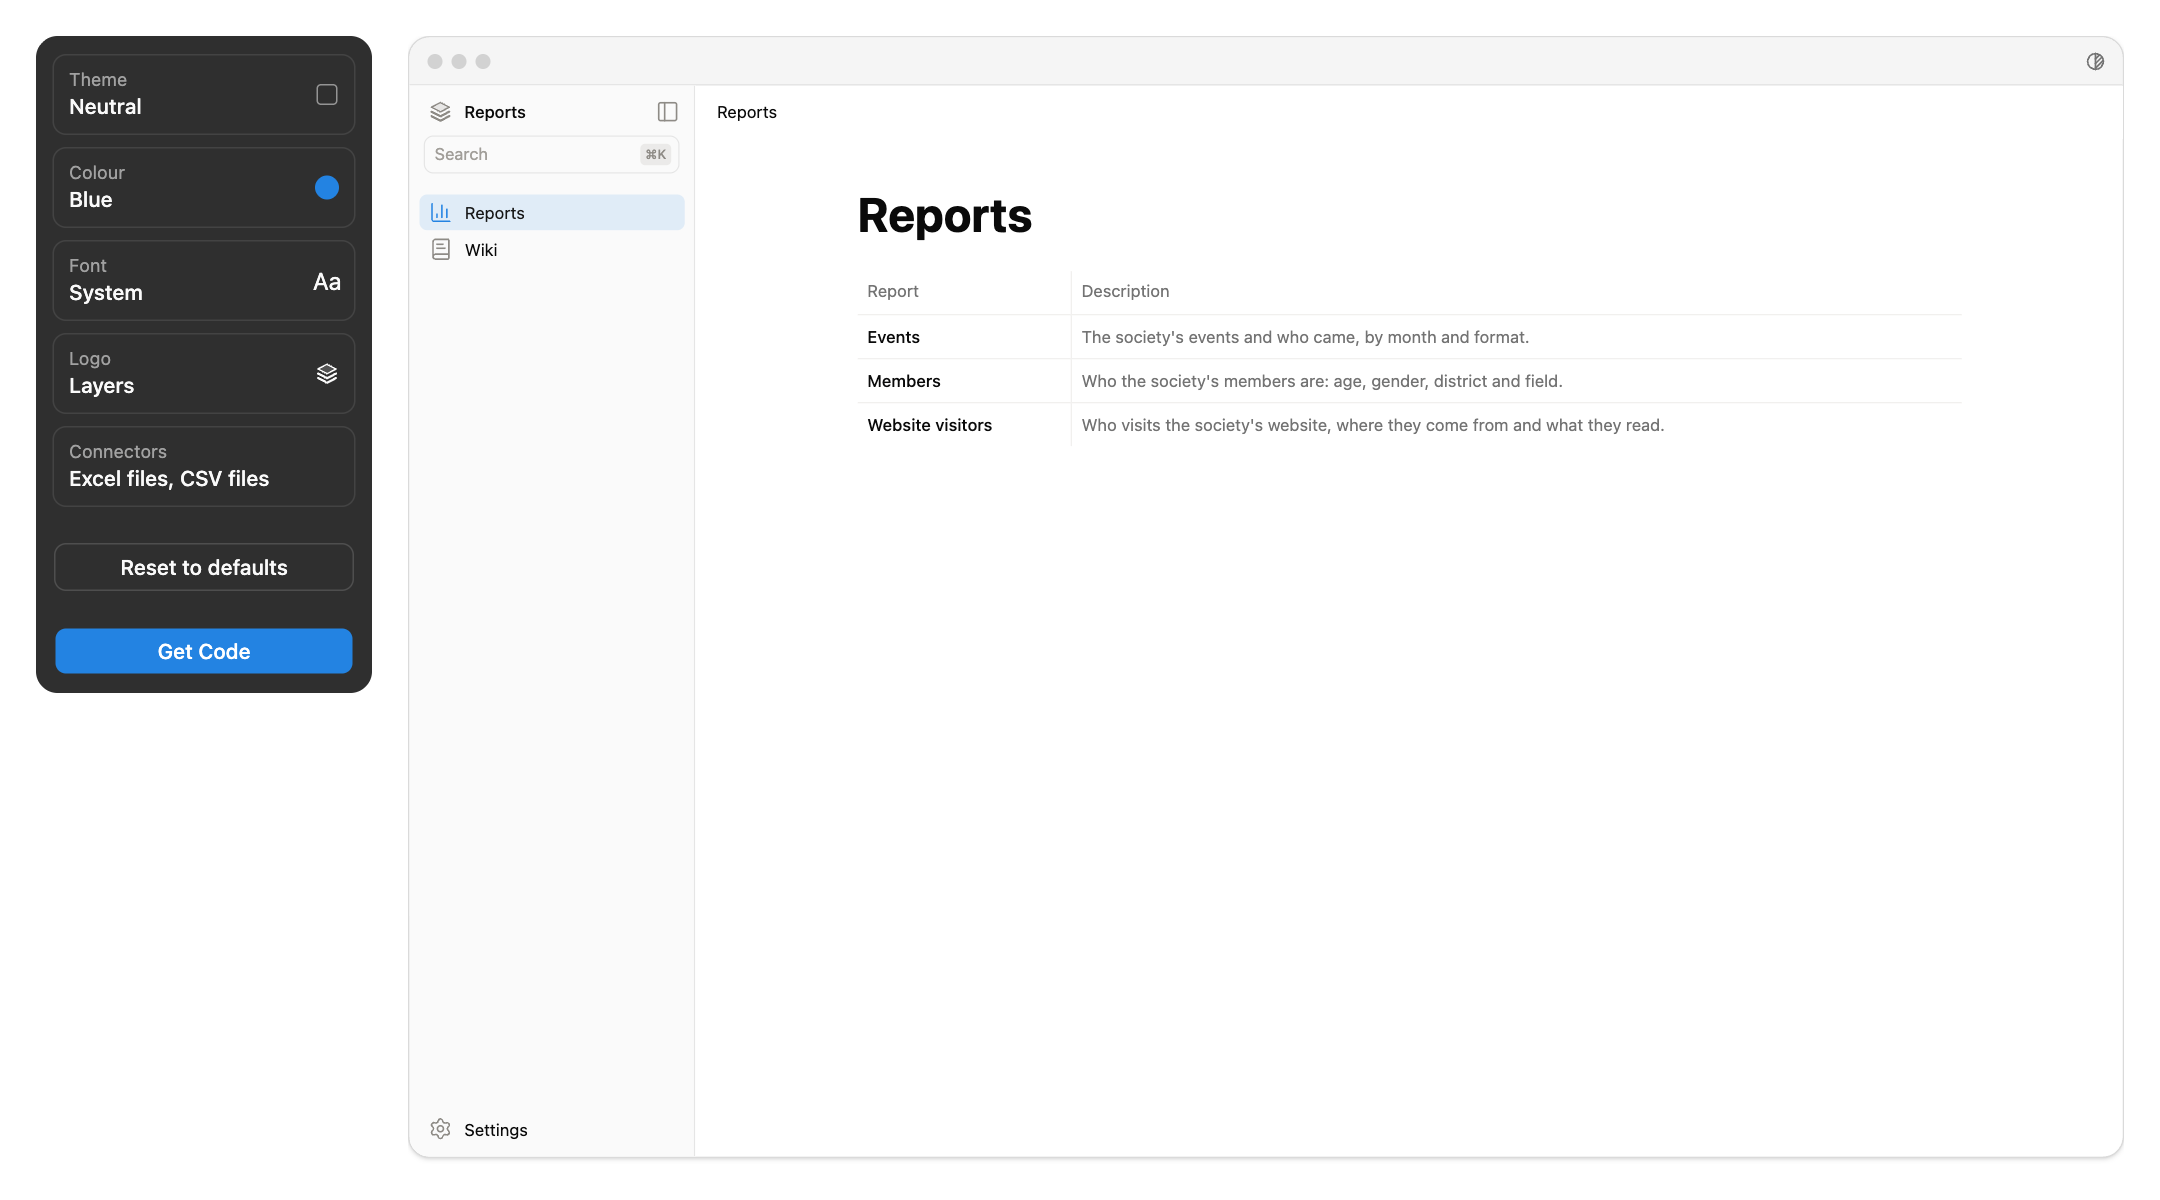
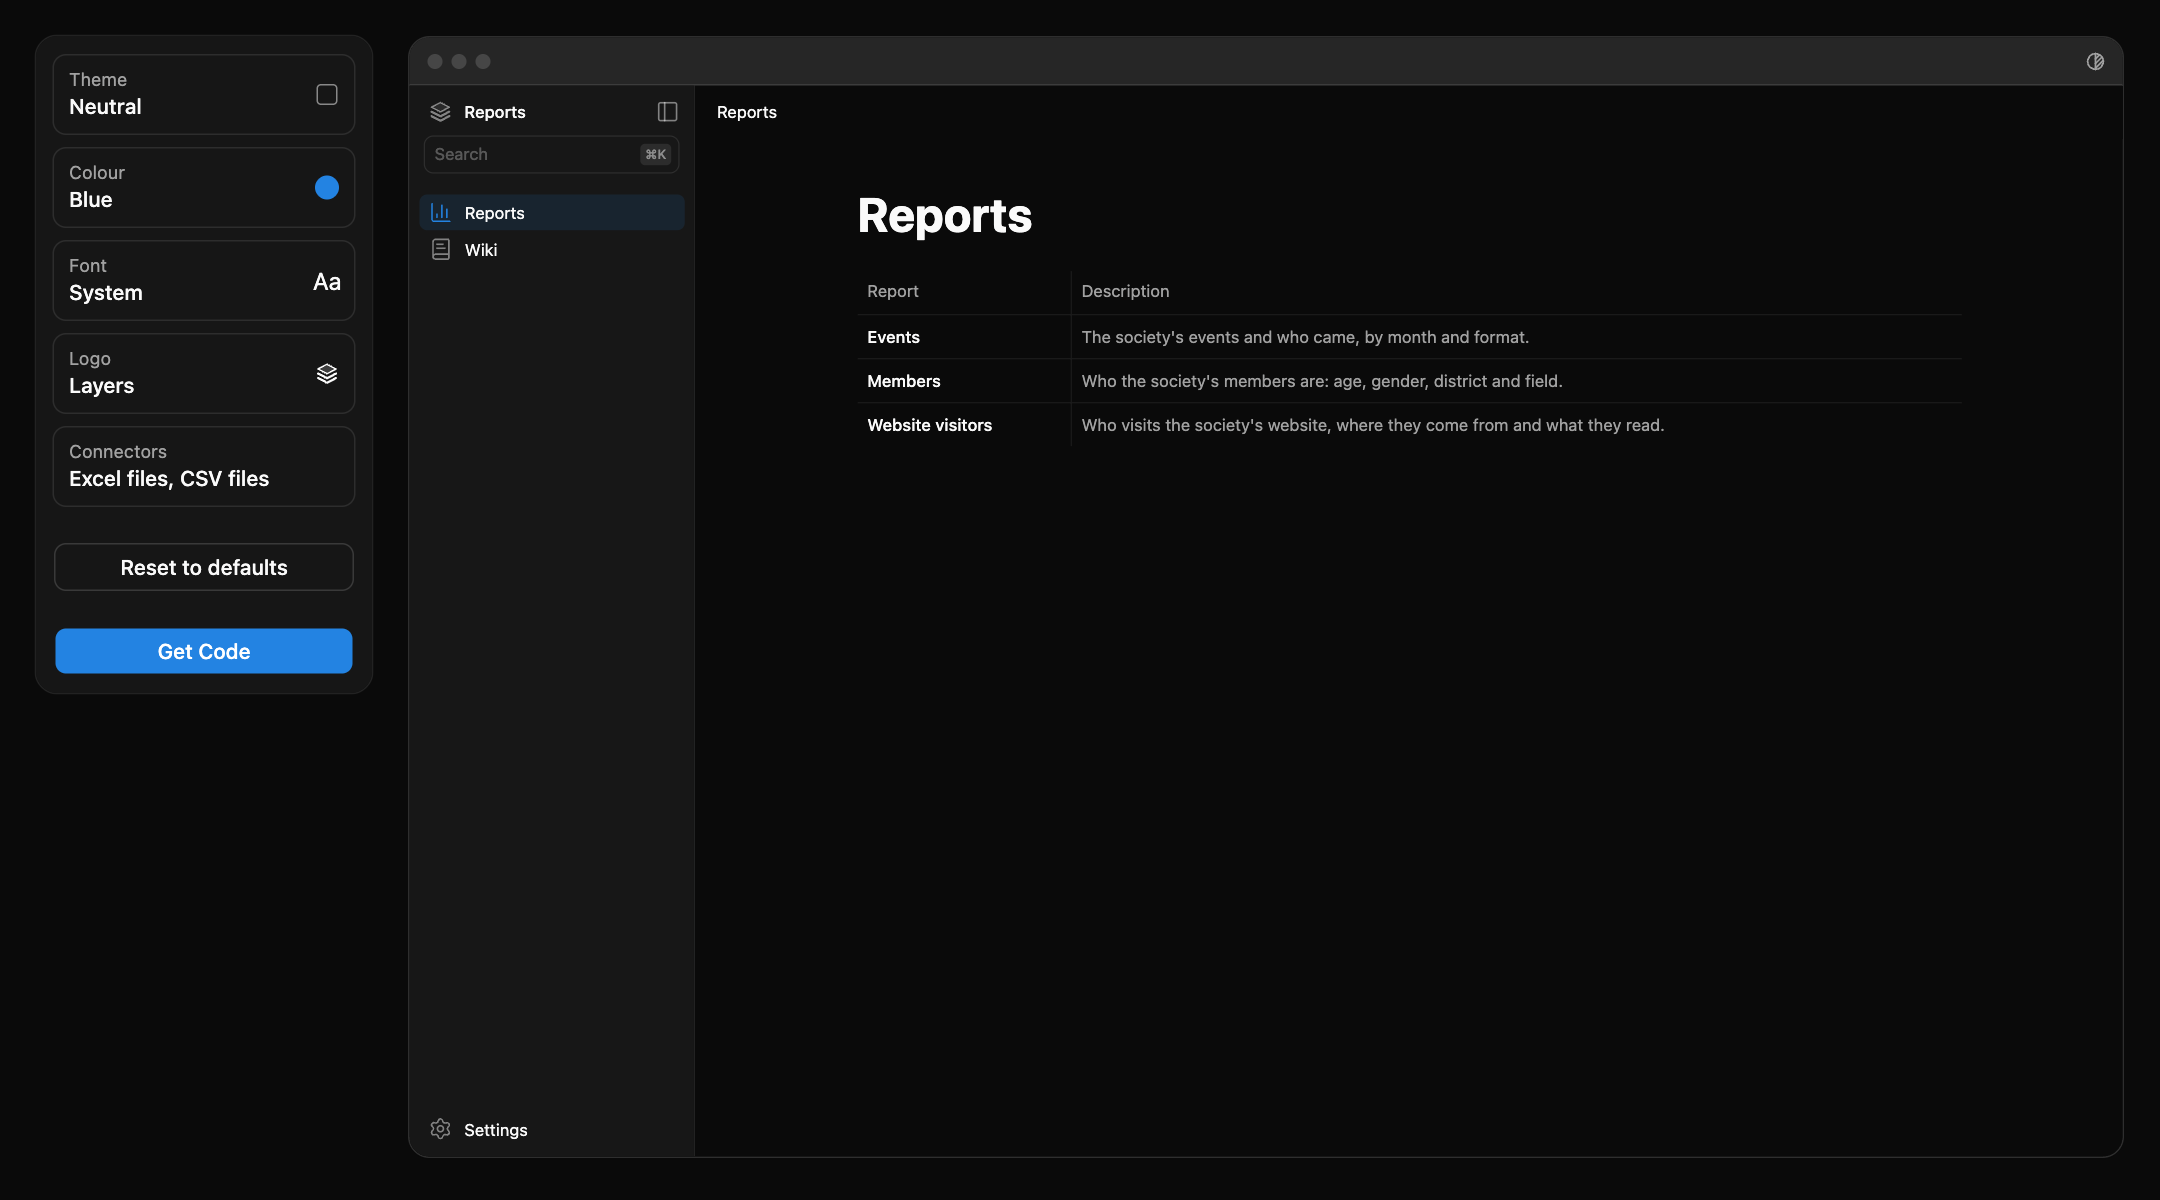
Open Create. The panel on the left has five choices, top to bottom:
- Theme: the style. Neutral (the default), Power BI, Tableau or Google Looker.
- Colour: the buttons and the charts. Blue (the default), Green, Purple, Orange, Pink or Grey.
- Font: System (the default), Inter, Geist, IBM Plex Sans, Lora or Roboto.
- Logo: the small mark at the top of the app’s sidebar, one of 48 shapes. Layers is the default.
- Connectors: which kinds of data the app can read. A connector is the part of the app that reads one kind of data: CSV files, Excel files, or a database such as Postgres. Excel files and CSV files are ticked to start with; tick a database too if your data is in one.
On the right is a live preview of your app: it changes as you pick. Nothing here is final; you can change every choice later. If you are unsure, keep the defaults.
Copy the prompt
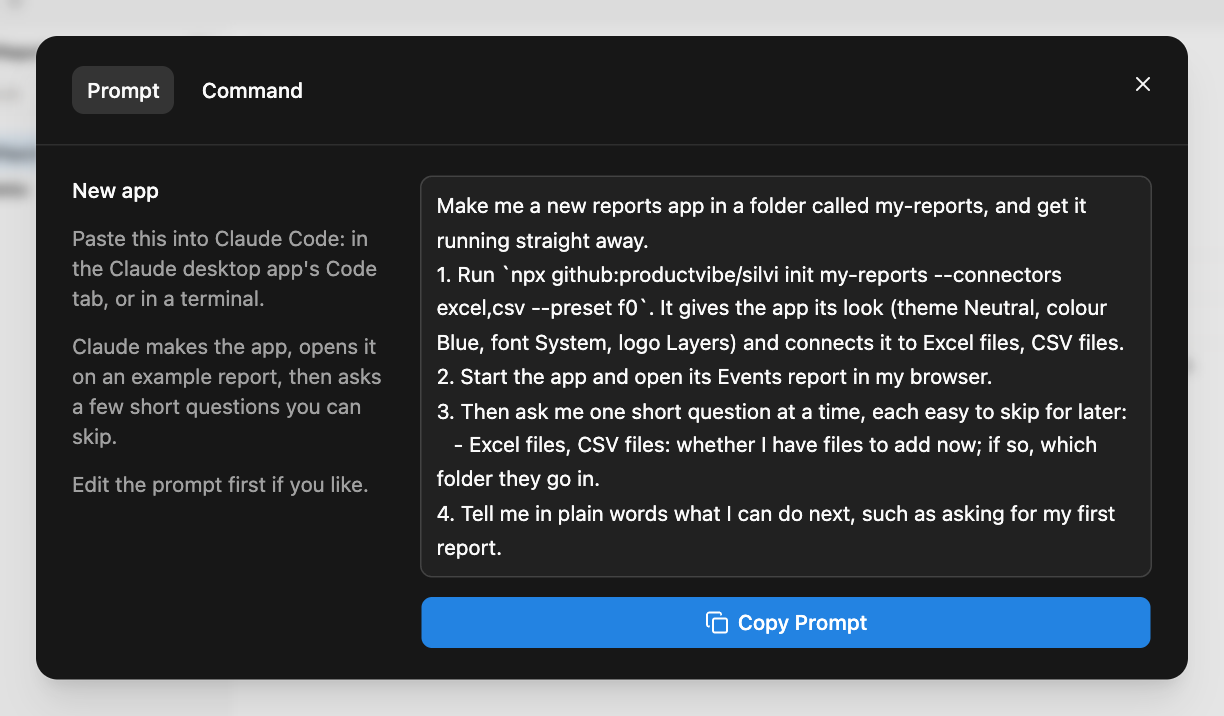
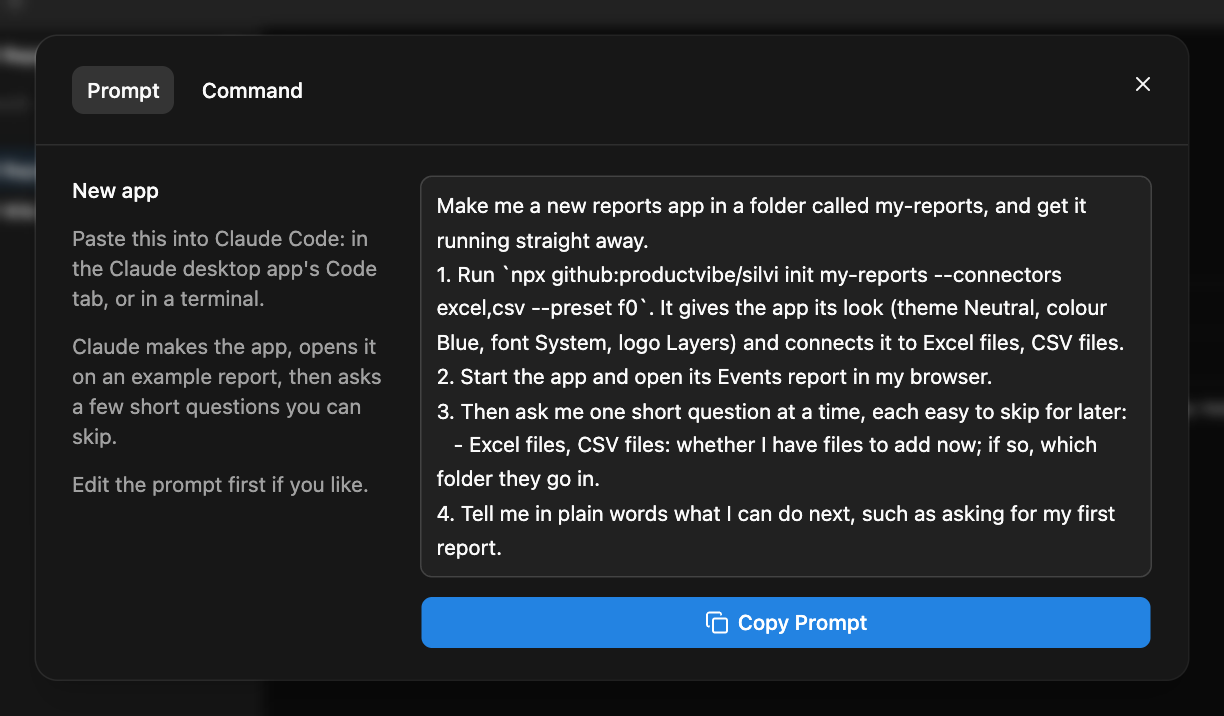
Click Get Code. It opens on the Prompt tab: a short message to Claude, written from your choices. It asks Claude to:
- make the app in a new folder called
my-reports, with your look and your connectors; - start the app and open its Events report in your browser;
- ask you a few short questions, one at a time, which you can skip: whether you have files to add now, or, for a database, its connection details;
- tell you what you can do next.
You can edit the text before you copy it, for example to change the folder name. Then click Copy Prompt.
Paste it into Claude
Make an empty folder for your reports, for example Reports in your Documents. In the Claude desktop app, open the Code tab, choose that folder, paste the prompt and send it.
Claude now downloads the app, installs what it needs, starts it, and opens it in your browser at http://localhost:9923. That address is not a website on the internet: localhost means “this computer”, and 9923 is the port, the number the app answers on. The app only runs while Claude keeps it running; if the page stops loading, ask Claude: “Start the app again.”
If Claude asks for permission to run a command, read what it says and allow it. If setup stops, paste the message to Claude and ask it to fix it.
Look around
Your browser opens on the Events report. The app comes with three example reports for a made-up data society in Copenhagen: Events, Members and Website visitors. They read sample CSV files that came with the app, so they work before you connect anything.
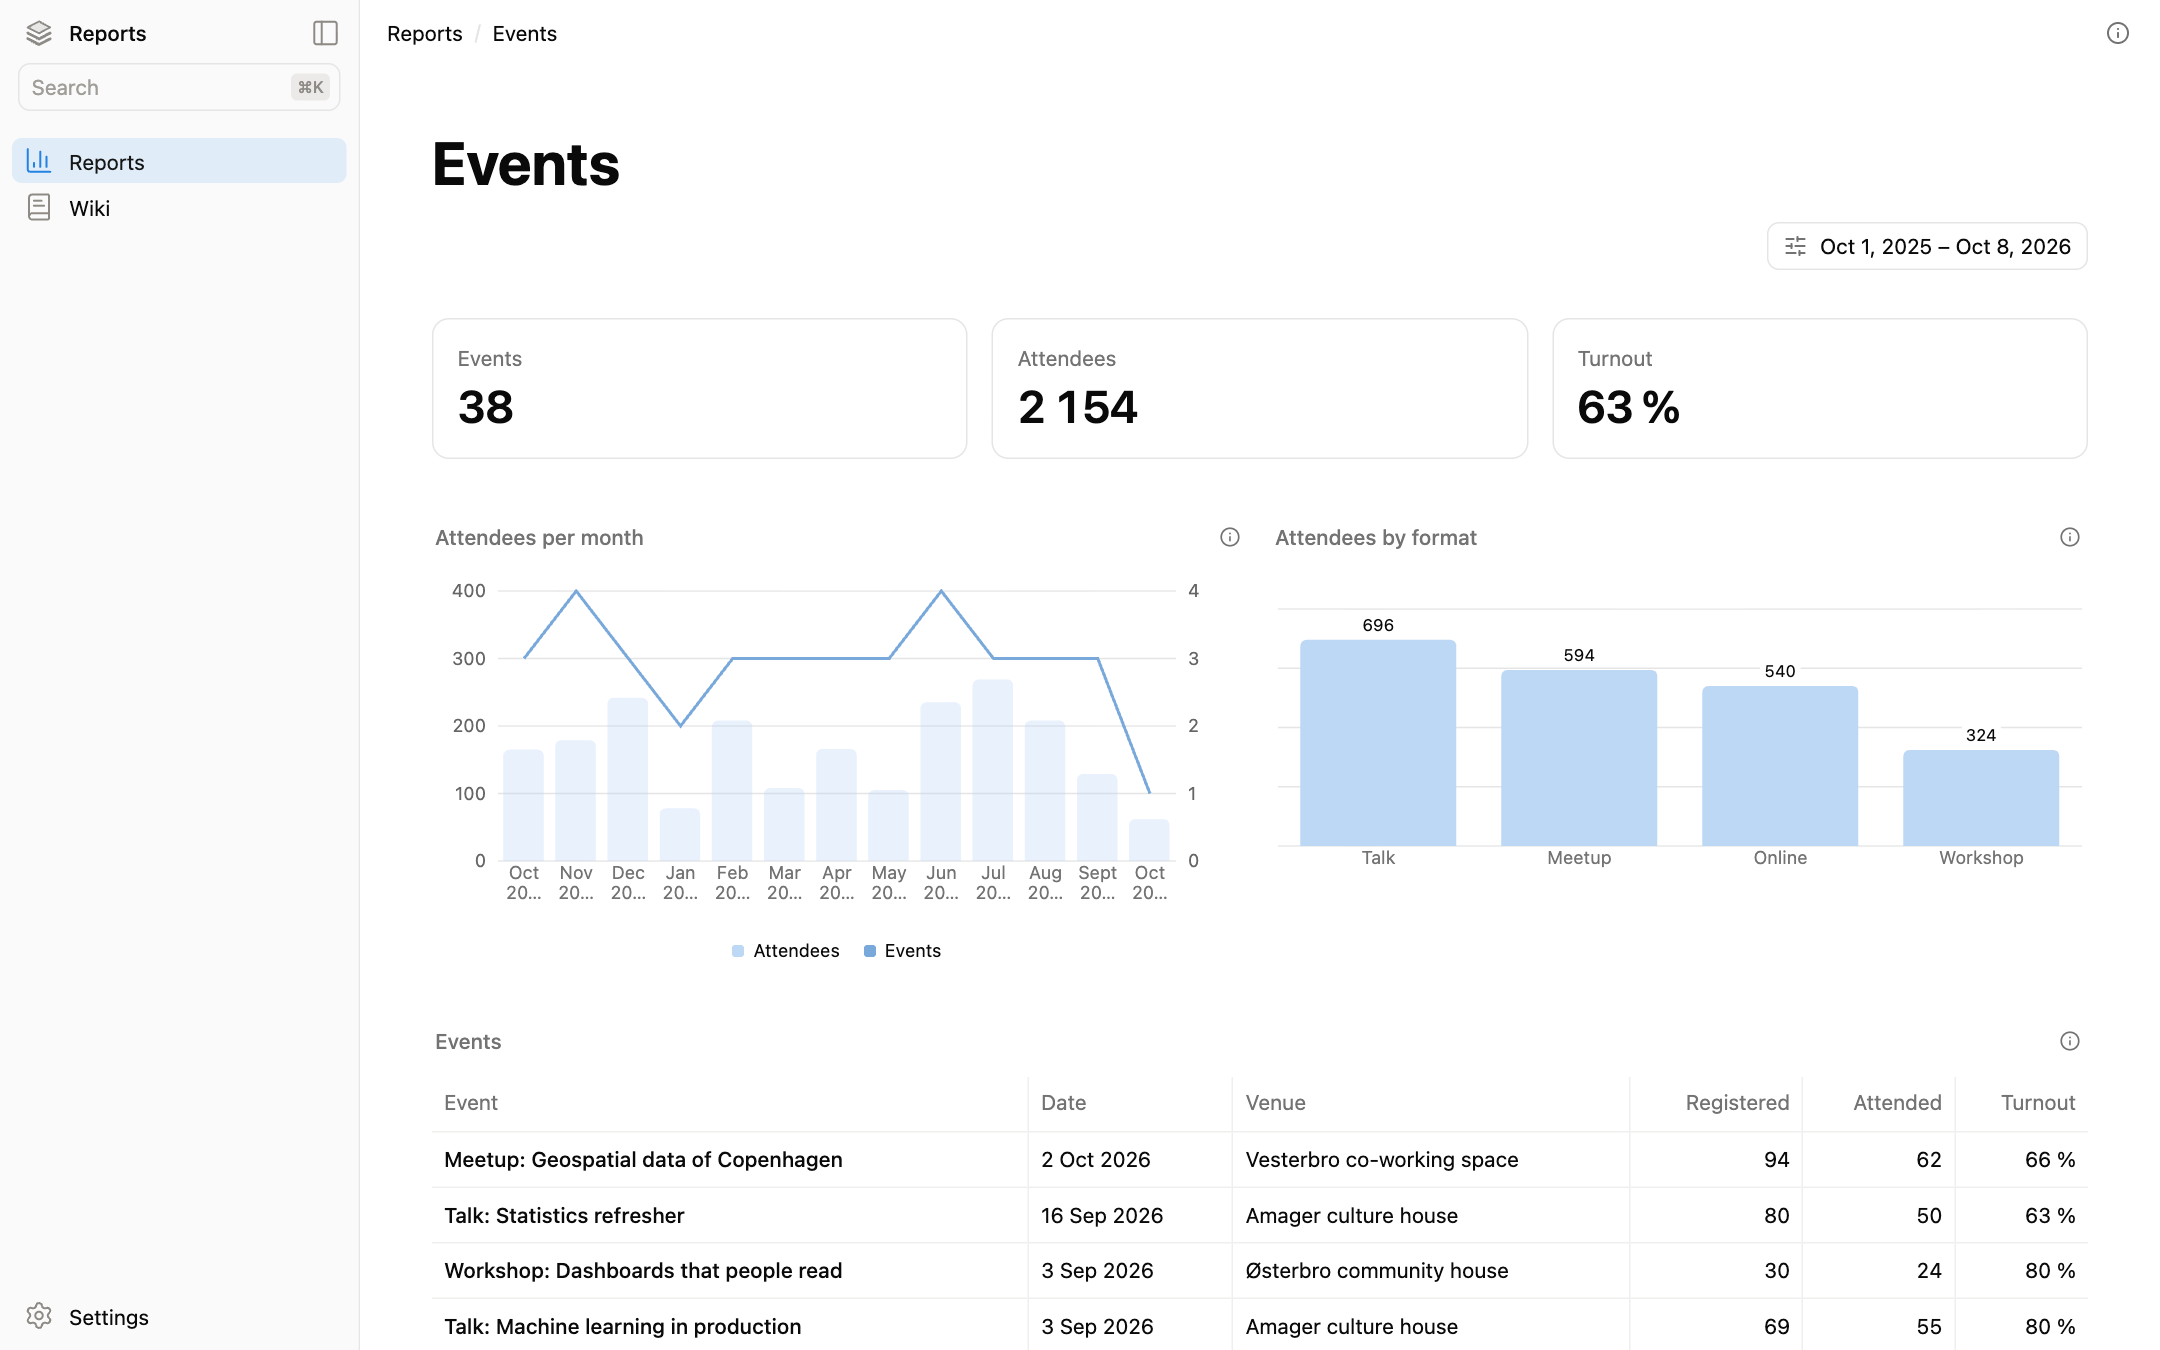
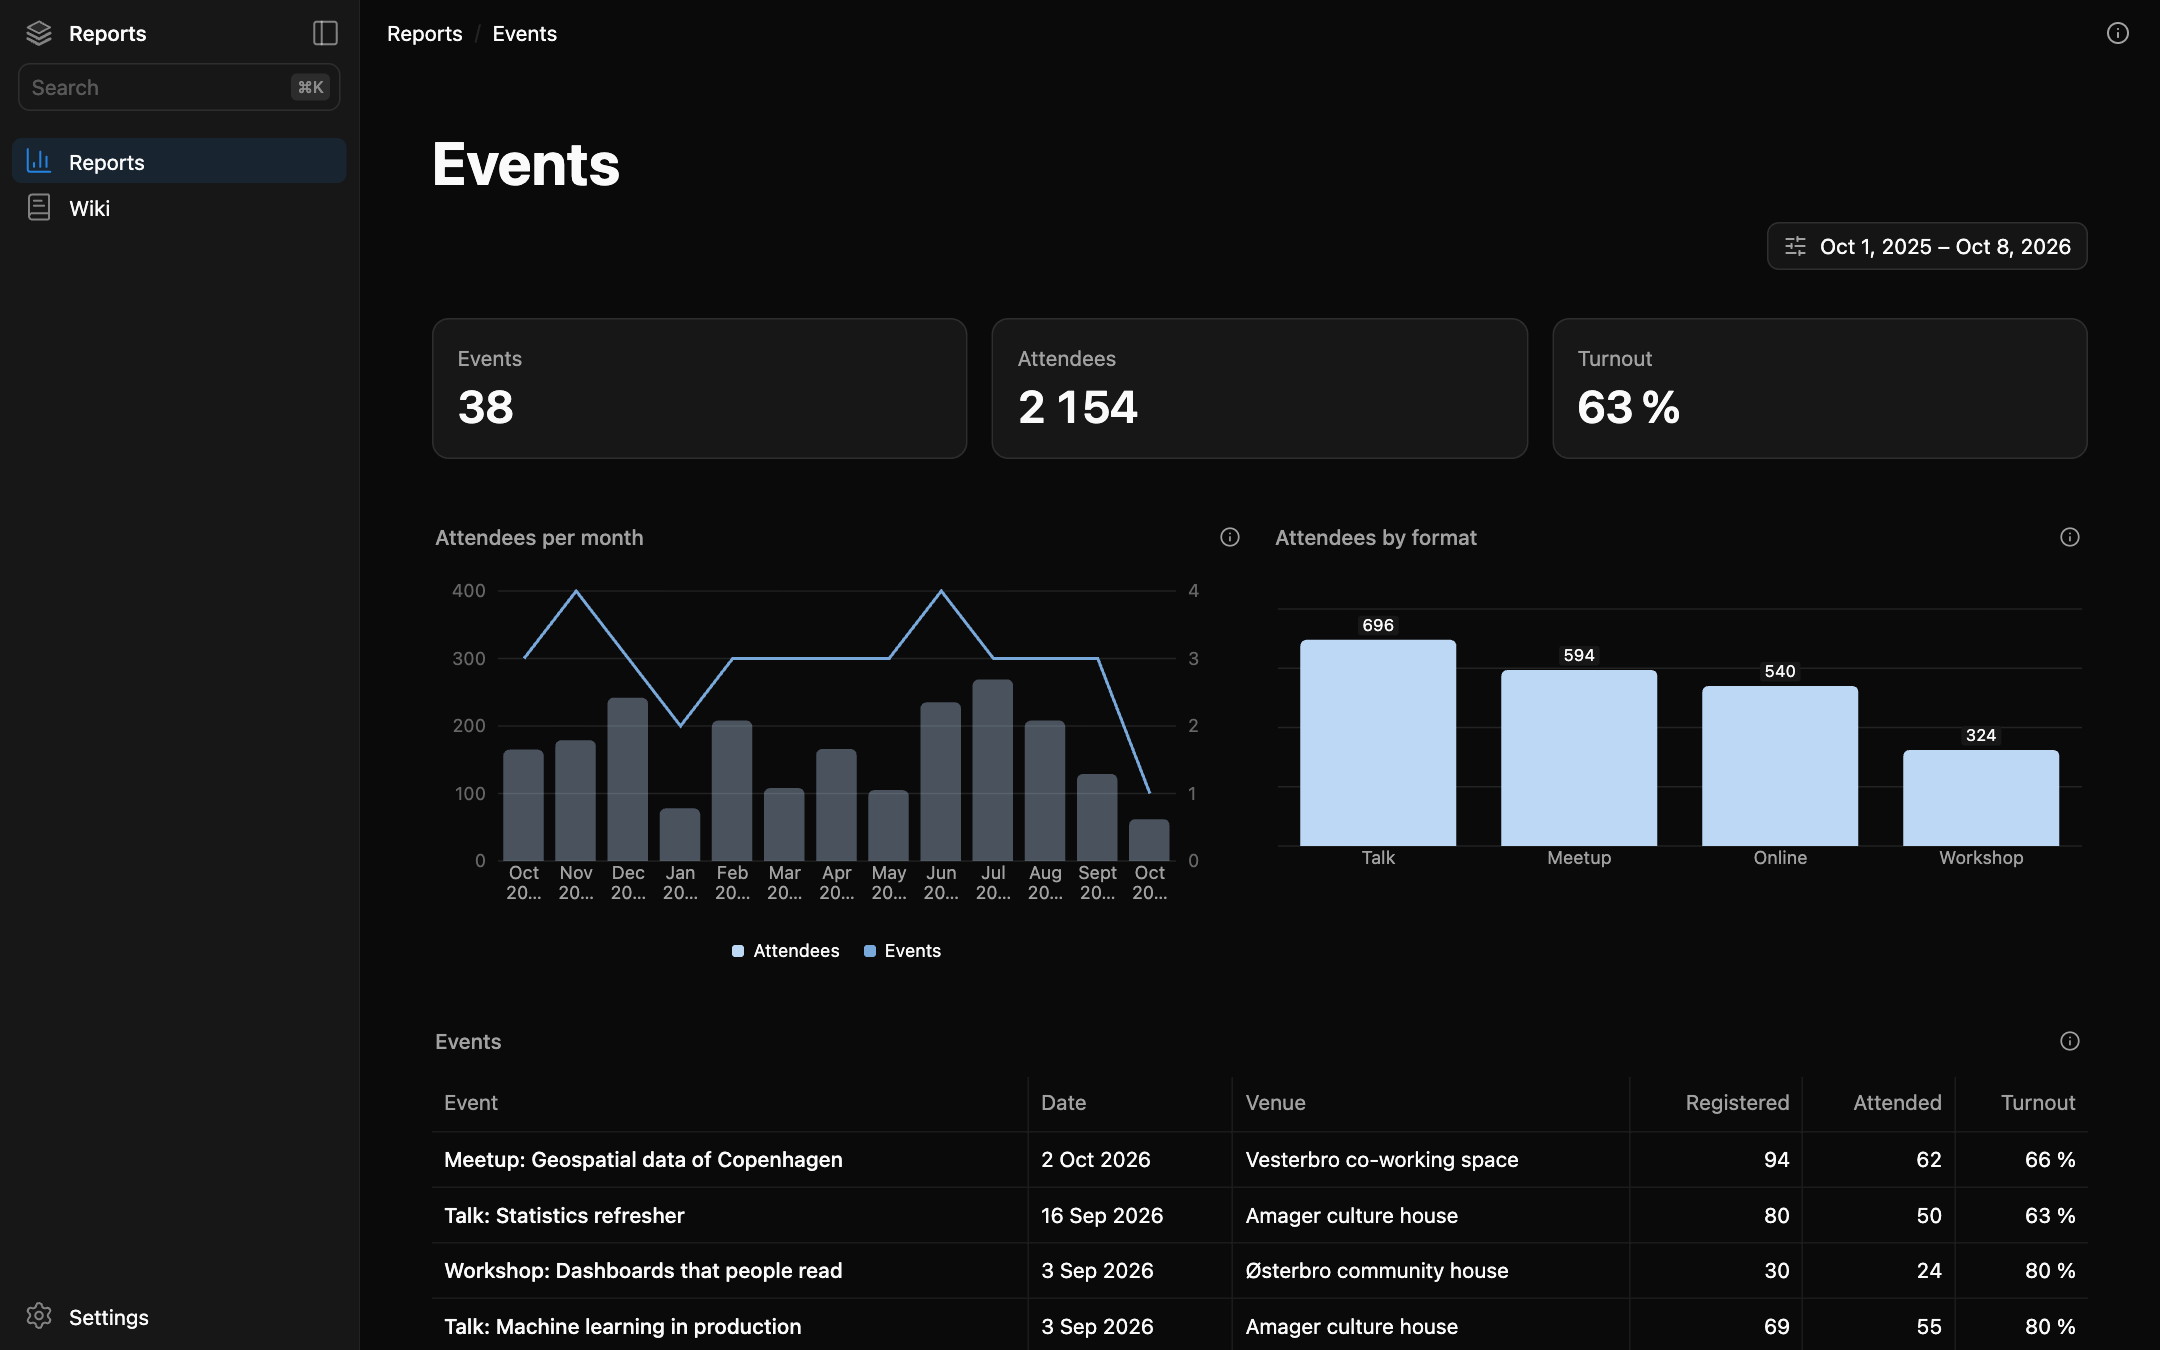
Click the (i) button at the top right of the report. It opens a dialog: its Info tab says what the figures mean; its Technical tab shows the SQL, the question the app asks the data, written in the standard language databases understand. Then try a first request in Claude. It only changes the example, so it is safe:
“In the Events report, add a chart of turnout by venue.”
Connect your own data
You can try everything on the example data first. When you want your own figures, tell Claude where they are:
“Here is orders.csv. Put it in the CSV folder and tell me which columns it has.”
Drag the file into the Claude chat, or say where it is on your computer. Each file becomes a table your reports can read. For a company database, you need a read-only user and its connection details from IT. Connect your own data shows both, step by step.
Change it later
Every choice from Create can change later. Ask Claude:
“Switch the theme to Tableau.”
“Add the BigQuery connector.”
Your reports stay as they are.
Next
Ask Claude for a report on your own data: Your first report.
Details for the curious
The command. Get Code’s Command tab shows the one command the prompt asks Claude to run, for people who use a terminal:
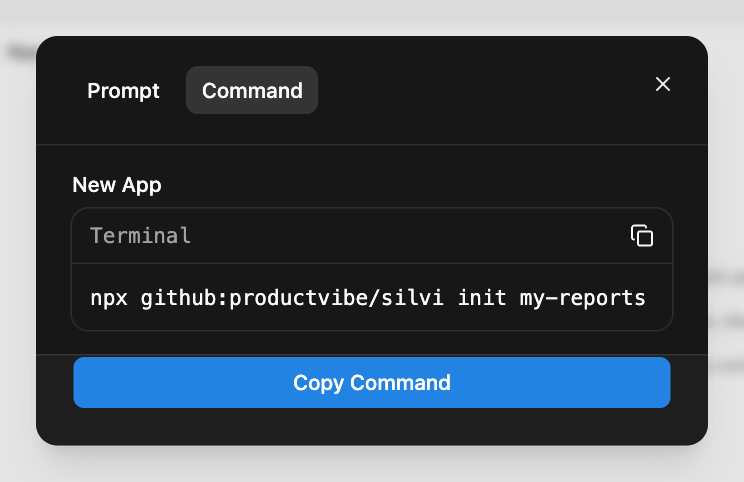
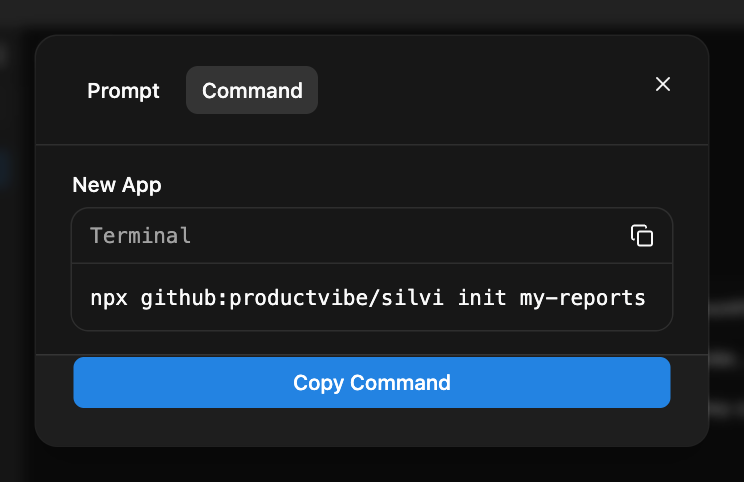
npx github:productvibe/silvi init my-reports --connectors excel,csv --preset f0npx fetches Silvi’s command-line tool (the CLI, a program you run by typing its name) from GitHub and runs it; that is why you need Node.js and git. There is nothing to install first, and the silvi package on npm is someone else’s. The CLI copies the kit, Silvi’s starting code, into the new folder: the app is yours from then on.
An app you already have. Inside its folder, Claude runs these to change the look or add a connector. Your reports and wiki are left alone:
npx github:productvibe/silvi apply --preset f0
npx github:productvibe/silvi add postgresThe preset code. Theme, colour, font and logo are packed into one short code, the preset, such as f0 (the default). It is in Create’s address bar while you pick, so a link to Create opens on the same look, and the app keeps it in app/src/theme.json. See Themes.
Without CSV. The example reports read CSV files. An app made without the CSV connector lists them as not connected.
Every command and option is on CLI.